

The latest dashboard report on the CEO’s desk is brilliant. It says performance has been nothing short of stellar in the latest period. The bank’s aggressive branch opening strategy has paid off handsomely. Deposits are up 15 percent, the attrition rate remains at 5 percent, and market share is up 2 percent in terms of assets under management. Return on Shareholder Equity is right on target. Board members are happy, shareholders are happy, the executive team is happy. As festivities continue, an insidious truth is lurking just under the surface: The bank is destroying long-term shareholder value and nobody is aware of it.
A short-term focus often undermines the long-term value of a bank. This is not a big revelation. In the wake of the recent financial crisis numerous pundits and industry experts have discussed the perils of focusing on short-term results. Nevertheless, stock exchanges around the world are ruthlessly critical of banks that fail to hit their expected targets.
Being a bank executive is a thorny task these days: On the one hand, countless newspaper articles are lambasting their focus on end-of-period results and deprecating the recklessness of managing their risks. On the other hand, analysts continue to judge executives’ performance by the numbers in quarterly financial reports. Everybody agrees that there is a need to strike a balance between short- and long-term results, but nobody can agree how.
A balanced answer
It’s important for a bank to understand how it is creating value in the short term by delivering profits on revenue from customers, and at the same time, creating (or destroying) value in the long term by building customer equity (or not). Return on Customer (ROC), developed by Don Peppers and Martha Rogers, Ph.D., proposes a simple performance metric that combines the two objectives (see “Return on Customer: A Core Metric of Value Creation”). Simply put, ROC is the sum of lifetime values of customers at the end of a period, plus profits delivered during the period, divided by the sum of lifetime values of customers at the beginning of the period. The underlying logic is nothing more than common sense: A firm must manage the total present plus future lifetime value of its customers to return the greatest value to its shareholders in both the short and the long run.
The challenge has been that customer lifetime value (LTV) management has found few enthusiasts in business circles. The missing link is the magic bullet of calculating LTV through the collection of data and weighting of the constellation of predictor variables. In addition, not all executives understand how LTV, once it’s calculated, will help drive better decisions and actions. At Peppers & Rogers Group, we have translated this academic concept into a business driver by considering ROC. In the case of one financial services company, the initial step was to overlay the bank’s internal customer data with an external view of the customer. In a sense it was matching the clues left by the customer on a bank’s transactions data with what the customer was actually saying.
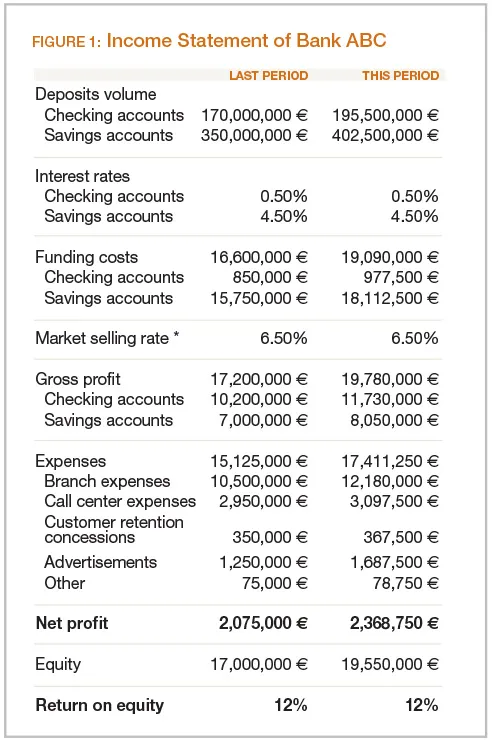
It is much easier to illustrate the methodology using the hypothetical case of Bank ABC as an example. The bank’s executives are celebrating excellent current results, as represented in Figure 1. Deposits are up 15 percent, and new deposits have increased 20 percent as a result of the bank’s branch network expansion, and its heavy advertising schedule. Additionally, churn is holding at 5 percent, and share of assets under management is up 2 percent thanks to recent acquisitions. However, branch expenditures are up 16 percent due to branch expansion, and ad spending increased 35 percent. Other costs increased on par with inflation, at 5 percent.
What is presented there may also be viewed from the customers’ perspective. Consider the findings from a survey of 300 randomly selected customers that Bank ABC conducted just before the close of this period (see Figure 2). Survey findings indicate three distinct customer groups within the bank:
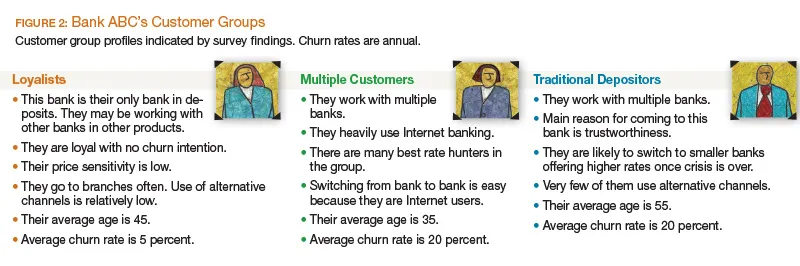
- Loyalists who have done long-term business with this bank
- Multiple customers, who shop around
- Traditional Depositors who have fled to a safe harbor, in this case Bank ABC, in the wake of the crisis
Hidden insights revealed
Although the results reported in Figure 1 look positive, they are incomplete. If Bank ABC’s executives recognize that customers account for all revenue, and that revenue per customer, minus the cost to serve the customer, results in an actual, accurate income for the bank, then the bank would demand an income statement broken into three parts based on its customer groups. That report would present disturbing facts (see Figure 3). For example, consider the costs related to Traditional Depositors. Instead of celebrating new-customer growth, the executive team should question the decision to expend so many of Bank ABC’s resources on this group.
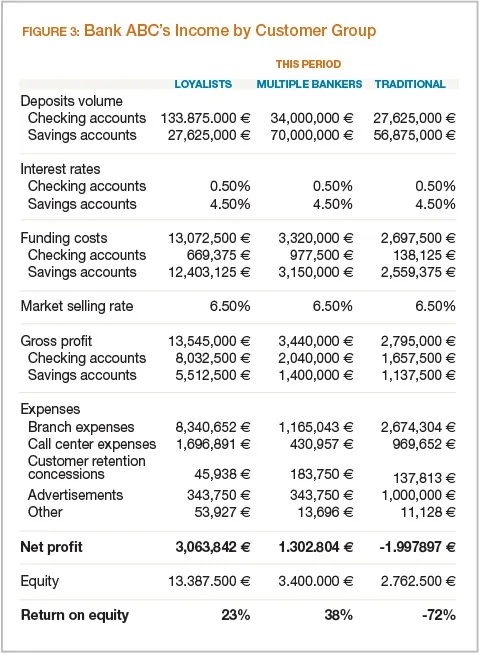
Additionally, the bank achieved a superior return on equity in the short run from Loyalists and Multiple Bankers, but Loyalists and Traditional Depositors will use a disproportionately larger share of branch operations expenses because these customers use branches much more frequently. In fact, the bank’s shareholders would have been better off without the Traditional Depositors. Bank ABC spent heavily to project a safe bank image via an aggressive advertising campaign in an effort to acquire new customers. So, it’s not unexpected that a greater than proportional share of advertising expenditures would be devoted to the Traditional Depositors group.
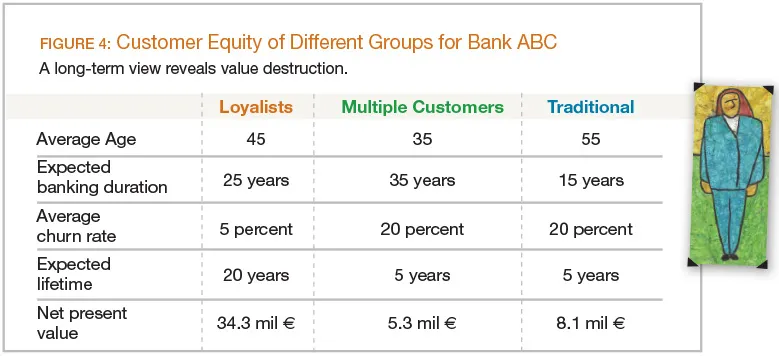
Looking at the longer run presents even more disturbing facts. Taking into account not only the current-period profitability of customers, but also the possible lifetime value of customers in the three groups, one discovers that Traditional Depositors are destroying shareholder value, while the Loyalists are keeping the bank in business and covering the losses on the Traditional Depositors.
Stock market analysts who are promoting Bank ABC shares because of its stellar past period performance should be questioning the Traditional Depositors. Figure 4 explains why. Far from illustrating the traditional 80/20 rule, we find something much more dramatic: the 220/20 rule. The top 20 percent of customers make 220 percent of the profit for the firm, while a large number of customers are eating away the profits. This goes unnoticed in a traditional income statement.
Cases resembling that of Bank ABC can be found in all industries. “Valuing Customers,” a study by Sunil Gupta, Donald R. Lehmann, and Jennifer A. Stuart in the Journal of Marketing Research (February 2004), shows how the customer equity value of Capital One, a well-known credit card company in the United States, would respond differently to a 1 percent improvement in retention rate, acquisition cost, and margin. While a 1 percent improvement in retention lifts company value by 5.1 percent, the same improvement in acquisition cost nudges value up by a mere 0.3 percent, and margin improvement by only 1.3 percent. The authors also show that the market value of Capital One moves hand in hand with customer equity value. In other words, customer equity and shareholder value are linked, and there is, therefore, little doubt where Bank ABC needs to invest and where it needs to avoid waste, based on current customer profitability coupled with long-term customer equity—in other words, Return on Customer.
Rethinking priorities
The case for Bank ABC makes it clear where priorities of the bank should be. So why do companies have such a hard time following the right path? The insurmountable barrier is the target-setting mechanism followed by most, if not all, banks. They invariably set their targets in terms of products: sell this many credit cards, extend that many mortgage loans, etc. And they focus only on the profitability of products, campaigns, and channels, or they focus on ROI to the exclusion of how many or what kinds of customers are “used” (e.g., disengaged by irrelevant communications) when pursuing company growth goals.
Trying to change completely the way targets are set is likely to be quixotic for many banks. When everybody on the stock market is holding their breath to see banks’ end-of-year growth on deposit volumes, it can be challenging to convince executives to evaluate these traditionally important figures in the context of the equally important ROC figure, which examines current profitability by customer in addition to long-term customer equity.
If Bank ABC were able to balance ROI and ROC—and require accountability for long-term as well as short-term results—consider the likely steps in the next planning and budgeting cycle for Bank ABC:
1. Investigate customer growth opportunities
- Look for product volume asymmetries in the Loyalist group, e.g., high deposit volume combined with low credit card volume.
- Identify cross-sell opportunities by data mining.
- Conduct a survey to uncover the primary motivators for the Loyalist group to accept cross-sell offers in different product categories. In other words, differentiate Most Growable Customers by needs, and communicate to those customers accordingly.
- Use needs differentiation strategies to design relevant offers and messaging, as well as possible value propositions and customer growth strategies.
- Calculate expected ROC in each case considering the likelihood of acceptance of cross-sell offers, the cost of extending these offers, and the resulting change in cash flow streams from customers in this group.
2. Investigate retention priorities
- Survey Multiple customers to determine an appropriate retention strategy. Understand what will motivate them to stay with the bank, as well as what would help to increase Bank ABC’s share of their business.
- Calculate the cost of retention to meet their needs.
- Identify the value proposition alternatives.
- Calculate expected churn rate decrease for each value proposition and retention strategy alternative.
- Estimate expected ROC in each case considering possible reduction in churn rate, cost of reducing churn by meeting the needs of this group, and resulting change in cash flow streams from customers in this group.
3. Act on acquisition priorities
- Survey people who do not currently do business with the bank.
- Identify conditions that could drive competitors’ customers to churn.
- Calculate the cost of acquisition.
- Identify different value propositions that will cater to customer groups who do not work with the bank.
- Calculate expected Return on Customer in each case considering cost of acquisition and cash flow streams expected from acquired customers.
- Emphasize a cessation in acquisition of high-cost, low-profitability customers.
4. Finalize product-based targets and budget
- Trade off growth, retention, and acquisition priorities based on the ROC values expected from different value propositions and strategies.
- Set priorities and allocate budgets by selecting value propositions and strategies that will yield the highest ROC figures.
- Finalize product-based targets and budget by considering:
- 1. Cross-sell targets to Loyalists.
- 2. Impact of reduced churn rate of Multiple customers on product targets and associated retention budget.
- 3. Product volume to be brought in by Traditional Depositors and associated acquisition budget.
Bank ABC will not necessarily meet all conditions demanded by all three groups. However, the process described above sets priorities for the bank in terms of how much to spend for growth, retention, and acquisition. It also defines exactly how to spend the money by identifying the value propositions and strategies that need to be adopted. Consider, for example, the following subgroups within the Loyalists:
Subgroup 1:
- Have a higher-than-average volume in a savings account.
- Do not roll over any credit card charges.
- Do not use Bank ABC credit card because of membership fees.
Subgroup 2:
- Have a higher-than-average volume in a savings account.
- Always roll over 25 to 30 percent of credit card charges.
- Do not use Bank ABC credit card because they found a better rate at Bank XYZ.
Should Bank ABC try to grow these subgroups by selling credit cards at the expense of, say, retaining more Multiple customers? If the bank chooses the former option, should it pitch a special deal with no membership fees or one that matches “the best rate you find in the market”? The planning and budgeting process that follows the methodology described above will help answer both questions systematically.
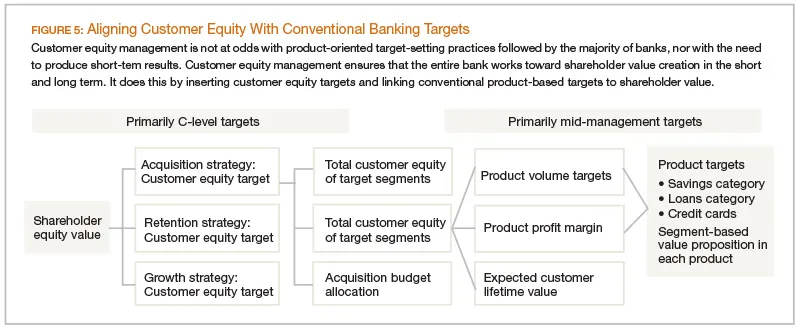
By following such a process, Bank ABC can have more confidence that targets will still be set by product categories and individual products, while the profile of customers and their LTV will also be factored in as performance parameters. Not only will the bank be able to track whether it has hit its short-term targets (by looking, for example, at the number of credit cards sold, volume of credit card charges, etc.), but it will also be able to track the long-term fundamental value through changes in its customer equity. This means it will be able to hold executives and managers accountable not just for current-period profitability, but also for projected long-term profitability. In effect, a layer of performance targets is being inserted into the CEO’s dashboard without turning everything upside down in the performance management system of the bank (see Figure 5).
Customer equity management, a topic often considered more worthy of academic ivory towers than of more practical, hard-nosed business discussions, is no longer a utopian concept. On the contrary, it can be a practical and useful tool for determining where a bank must concentrate its efforts to meet both short- and long-term targets. Indeed, it is a critical tool for any bank’s long-term success, and all it takes is enriching customer data with a carefully designed market survey. The obvious benefit is ensuring that maximum shareholder value is delivered, which in our view is the raison d’etre of an executive team.