


There is no doubt that there have been great strides made when it comes to measuring the impact of customer experience activities across the enterprise. NPS, CSAT, and CES (customer effort score), for example, help to focus the organization on immediate root cause problems. Observing what customers ‘do’ through Big Data analytics can effectively predict next best action and infer loss aversion.
However, within a business environment of increased complexity and change, such metrics cannot explain the whole of a customer’s experience with a brand. The explanatory power of attitudinal metrics on behaviors such as spend account for, at best, 15-20 percent of customer understanding, and is highly variable by context.
Even Big Data, which gives visibility into how the customer would think and feel, is still not the whole story. Otherwise we would not find that telecom customers on the same network with the same experience give different NPS scores. Or that the perception of a mobile signal is impacted by perception of brand, price, and customer service.
Many companies are turning to predictive analytics to be more proactive with customers. However, they don’t take into account the day-to-day changes in attitudes and feelings that are a natural consequence of constant interactions with the world. Just because customers felt a particular way about something yesterday does not guarantee they feel the same way today or tomorrow.
So, while predictive analytics is highly effective in a world of predictability, we need a different, complementary metric as the business world becomes more uncertain, interconnected, and complex. One that is more agile and real time, accounting for the psychological relationship the consumer has with the brand. We need metrics that chip away at that unknown, fuzzy 85 percent of customer understanding while maintaining the use of predictive analytics techniques.
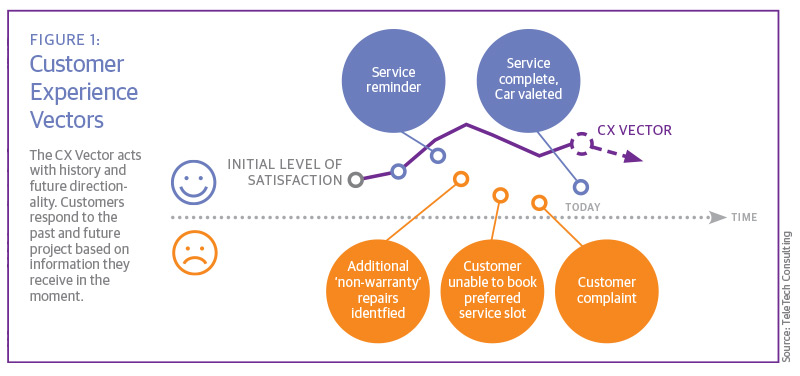
CX vector analysis
We call this new approach CX Vector analysis. It measures the current position, direction, and speed of customer experience sentiment. These three variables allow companies to plot coordinates on a diagram to identify movement and trends in an individual’s customer experience.
CX Vector analysis acts as an early warning system, making businesses aware of the weak signals of emerging change. This allows leaders to focus on the current reality and where it is evolving, not where it has been. It can be a leading indicator that predicts future behavior, rather than a lagging indicator that relies on historical information.
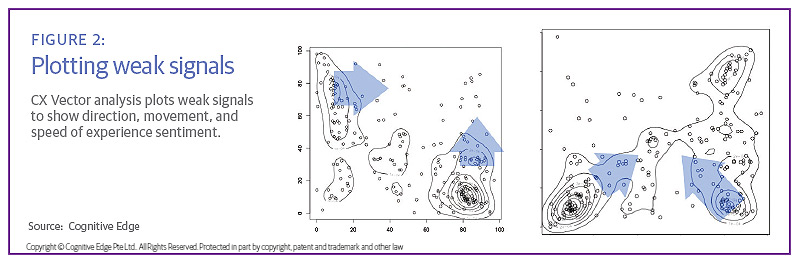
A CX Vector is made up of what we call “weak signals.” They are indicators that may otherwise be missed because they are so small when looked at as a single snapshot. But taken over time and weighted, they pull the vector in a direction and give it speed in a true representation of the customer experience.
Weak signals often come from unstructured narrative, such as when customers answer open-ended questions or provide information voluntarily that can’t be easily categorized. It also comes from observed structured data that is of itself insignificant, but can accumulate into significance.
A weak signal indicator could be something that has a relatively low frequency (not many people are mentioning it yet) but a potentially enormous impact. For example, feedback such as, “The brakes on this car have started to feel spongy,” “This car takes a long time to come to a halt,” and “I nearly had an accident because I couldn’t stop in time,” all point to a similar issue, but it requires a sophisticated categorization system to realize that these (negative) comments are all about the brakes.
Weak signals are often missed because they are not associated with other data that shares some meta-attribute (e.g. color, trim, materials) that can be categorized to link discrete pieces of data around the unstructured feedback such as, “I liked the color of this car and the leather seats are great.” Signals can also be missed if they are misclassified. Unstructured data can be interpreted in different ways and the original meaning may be skewed.
To be effective, we recommend associating weak signals with other emotionally descriptive attributes to gain context. “I LOVE the leather seats; gray is such a boring color,” for example. After all, emotions play an important role in individual perception of the experience.
Weak signals at work
As an example, I regularly go on holiday to the English seaside. Last year, aggressive seagulls were constantly stealing food and generally being a nuisance. This is an experience that is gradually increasing the dissatisfaction comments of visitors to that beach. While only affecting a few holidaymakers now, it might grow to drive visitors somewhere else next summer.
A potential CX Vector called “a good beach holiday experience” is influenced by these weak signals in the experience. By looking at the speed, position, and direction of that experience, you can proactively disrupt or dampen the weak signals before they grow larger and more difficult to control.
On a flight, predictive analytics may explain what correlates to overall satisfaction, such as getting a good price, ease of boarding, legroom, and so forth. So what might a CX Vector pick up that predictive analytics does not? Let’s use the example of ease of boarding. This metric is impacted by dispositional events that do not repeat in entirely predictable ways. Some factors that contribute to someone’s ease of boarding lacks prior predictability but can reveal themselves over time and enable action to amplify or dampen.
On one occasion, I arrived at my seat to find an empty luggage rack. I put my hand luggage there only for it to be pulled out by the person sitting next to me. Cue a major argument. How lenient flight attendants are in letting passengers handle their own luggage arguments can influence perception and the overall experience, even without structured insight in this area.
In other words, a potential increasingly bad event is not visible in aggregate through predictive analytics, but is visible by looking at individual incidents that have an emotionally powerful and behaviorally impactful effect. The speed by which these small incidents grows is also very telling, if you know to look for it.
Being aware of these subtly shifting influences reveals where the CX Vector is heading, what kinds of experiences (customer, employee, or machine) should be mapped and monitored, and adds color to predictive analytics and customer journey maps, defining new inflection points.
How to apply CX Vector analysis
But when is a weak signal something to amplify or control, and when is it just noise? This is where emotional impact, level of growth in a population, and weak signal definition and relevance is important. The CXV methodology uniquely adopts and combines proven best practice techniques in:
- The use of Big Data
- Transcript analytics (sentiment and thematic analysis)
- Regression modeling (based on survey results)
- Predictive modeling (supported by structured equation modeling)
- Weak signal surveys (supported by consumer psychology)
The approach taken depends on the level of maturity of the organization. Most companies fit into one of three levels:
Level 1: Use what’s already being collected. At its simplest, we can take in existing verbatims (customer or employee) from surveys, text, social media, or voice to text alongside digital or machine data. By analyzing this input, with the customer journey in mind, we can discover weak signals within the CX Vector or identify data gaps in their detection. These could be filled in part by slight amendments to existing surveys and analytics processes.
Level 2: Amend existing customer experience survey, mapping, or KPI structures to pick up weak signals alongside predictive analytics within the CX Vector. This already happens in some environments, especially where there is a high degree of inherent complexity, such as government entities.
Level 3: At the highest level of complexity we can do all these things together as a Big Data analytics structure, combining insights from objective and subjective data.
We define each company’s most relevant CX Vectors and weak signals to complement existing predictive analytics. The CX Vector mapping process and analytics happens in four phases:
1. Customer journey mapping and persona identification:
We identify who the customer is through identified personas and high-level customer journey mapping. This delivers the focus of our CX analytics process and achieves internal buy-in.
2. Data collection and categorization:
In phase 2 we collect, categorize, and ingest customer data as it relates to the defined scope of personas and journeys. This is the first stage of our analytics exercise, and uncovers gaps in weak signal detection as well as high level insights.
3. Vector analytics and setting of CX Vector KPIS:
Here is where we introduce the concept of vector: a point of origin, a direction of travel and a velocity. In this step we build our CX Vectors within which we identify the weak signals. The idea is to create a real-time, multi-dimensional indicator of emotional state throughout the journey that can be used as an explanatory variable—and in turn identify opportunities and issues to address. In other words, we complement existing processes within the firm, just assembling them in new ways.
4. Adaptation of customer journey maps to CX Vector maps:
Ultimately, all this efforts leads to the overlay and identification of new customer experiences and the amendment of key lifecycle moments and journey maps.
By identifying these signals, executives are provided with insight into underlying, emerging issues related to their experience delivery. This enables early intervention to prevent negative occurrences before they become damaging, as well as promote and amplify positive experiences to encourage uptake.
Weak signaling and CX Vector may not apply everywhere. In some cases, noise is just noise, and a few data points do not necessarily make a valuable trend. And CX Vector analysis should not replace other valuable insight tools such as predictive analytics, voice of the customer analysis, and others. It is designed to be another tool in your arsenal to understand what customers are trying to tell you, even in the most subtle of ways.
And, as with any data or technology, it is not a panacea. Creativity is not included. While CX Vector analysis can uncover potential innovations to amplify and repurpose activities, creativity in how best to do so remains within the realm of design and less so analytics. The best approach is to have a cross-functional team understand the end-to-end experience and how to improve it, using CX Vector metrics to support decision making.
Conclusion
It’s a brave new world of data, where insight can be found nearly everywhere. The more nimble a company is to listen and adjust in the right ways, the better positioned it will be to succeed both now, and in the future. Weak signals may make all the difference in strengthening customer relationships and business overall, by seeing more clearly how things are evolving and by setting parameter metrics.
Note: Matt Johns, executive director of TeleTech Consulting; Dave Snowden, founder of Cognitive Edge; and Sonja Blignaut, founder & CEO of More Beyond, contributed to this article.